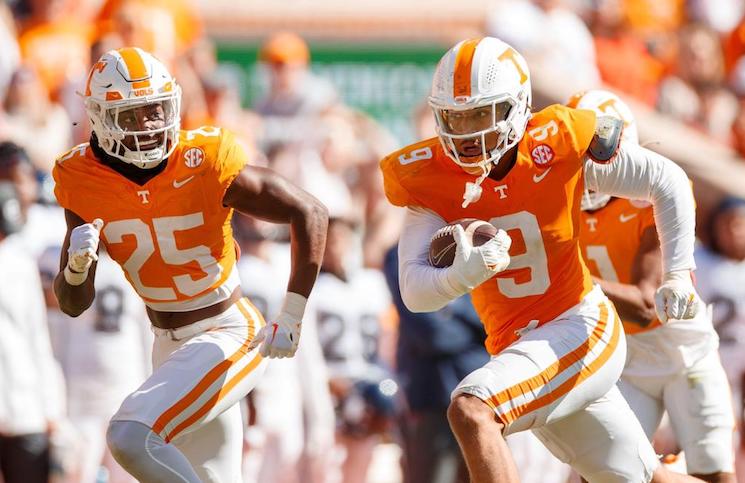
No. 21 Tennessee football (7-4, 3-4 SEC) is set to host in-state rival Vanderbilt (2-9, 0-7 SEC) inside Neyland Stadium this weekend for the regular season finale at 3:30 p.m. ET on the SEC Network.
Tennessee will be looking to bounce back after back-to-back losses to Missouri and Georgia. It’s also Senior Day, meaning Saturday will be a special one for many Vols.
With a win, the Vols will win eight regular-season games for the second consecutive season for the first time since 2015 and 2016. Additionally, Heupel is looking to become the first Tennessee head coach to have two eight win seasons in his first three years as head coach since Phillip Fulmer.
As for Vanderbilt, the Commodores are still searching for their first SEC win of the season. After a 2-0 start, Vanderbilt has lost nine straight and are looking to avoid their second two-win season in three years.
Tennessee’s offense has been significantly struggling in their two-game losing streak, so more than anything else, the Vols need to get back on track offensively before likely facing a tough Big Ten defense in the bowl game.
Let’s take a look at how the Vols and ‘Dores stack up against one another.
Quarterback
Tennessee: Joe Milton III
Season stats (11 games):
207 completions on 321 attempts, 2,430 yards, 16 TD, 5 INT, 64.49 comp. %, 220.91 YPG, 11.7 yards per completion
73 rushes, 288 yards, 5 TD, 26.18 yards per game
Where Milton ranks in the SEC:
- 7th in yards
- 6th in completions, T-5th in attempts
- 9th in comp. %
- 9th in yards per pass attempt (51st in FBS) (7.57)
- 10th in TD (16)
- T-8th in INT (5)
- 8th in QBR (141.41)
Vanderbilt: AJ Swann, Ken Seals
*We don’t know who Vanderbilt is starting, yet. Swann started the first five games before being benched for Seals.*
Season stats:
Ken Seals
98 completions on 170 attempts, 1,122 yards, 10 TD, 4 INT, 57.65 comp. %, 124.7 YPG (low because he played in games as a backup), 11.45 yards per completion
37 rushes, 20 yards, 1 TD, 2.2 YPG
Where Seals ranks in the SEC:
- 15th in yards
- 14th in completions, 15th in attempts
- 13th in comp. %
- 15th in yards per pass attempt (83rd in FBS) (6.60)
- 14th in TD (10)
- T-12th in INT (4)
- 15th in QBR (127.79)
AJ Swann
93 completions on 173 attempts, 1,290 yards, 11 TD, 7 INT, 53.76 comp. %, 258.0 YPG, 13.87 yards per completion
25 rushes, 28 yards, 1 TD, 5.6 YPG
Where Swann ranks in the SEC:
- 14th in yards
- 15th in completions, 14th in attempts
- 15th in comp. %
- 10th in yards per pass attempt (55th in FBS) (7.46)
- 14th in TD (10)
- T-12th in INT (4)
- 15th in QBR (127.79)
Advantage: Tennessee
Explanation: No matter who Vanderbilt starts, Tennessee has the edge at quarterback. Joe Milton III has not played good football as of late, but he’s clearly better than either option Vanderbilt has.
Running Back
Tennessee: Jaylen Wright, Jabari Small, Dylan Sampson
Tennessee rushing stats (11 games):
- 2nd in SEC with 2,263 rushing yards
- 2nd in SEC with 205.73 yards per game
- 2nd in SEC with 5.62 yards per attempt
- 18 rush TD (9th in SEC)
- Wright: 126 att., 938 yards, 4 TD, 7.4 YPC, 85.27 YPG (1st among RB in SEC and 1st in FBS in YPC, 3rd in SEC in YPG among RB)
- Wright receiving: 21 rec., 132 yards, 0 TD, 12.00 YPG
- Small: 91 att., 445 yards, 2 TD, 4.9 YPC, 44.50 YPG
- Sampson: 76 att., 434 yards, 7 TD, 5.7 YPC (8th in SEC), 43.4 YPG
- Sampson receiving: 17 rec., 175 yards, 1 TD, 17.5 YPG
Vanderbilt: Sedrick Alexander, Patrick Smith
Vanderbilt rushing stats (11 games):
- 13th in SEC with 1,065 rushing yards
- 13th in SEC with 96.82 yards per game
- 13th in SEC with 3.34 yards per attempt
- 9 rush TD (13th in SEC)
- Alexander: 85 att., 325 yards, 4 TD, 3.8 YPC, 29.5 YPG (25th in SEC in yards, 26th in AVG)
- Alexander receiving: 16 rec., 113 yards, 0 TD, 10.3 YPG
- Smith: 70 att., 300 yards, 2 TD, 4.3 YPC, 30.0 YPG
Advantage: Tennessee
Explanation: The fact Vanderbilt’s leading rusher has only 325 yards should tell you all you need to know. Jaylen Wright has more yards than Vanderbilt’s running back duo combined. Oh, and Jabari Small and Dylan Sampson each have more yards than Vanderbilt’s leading rusher.
*Keep an eye out for Jaylen Wright to reach 1,000 yards rushing on the season in this game*
Pass Catchers
Tennessee: WRs Squirrel White, Ramel Keyton, Chas Nimrod, TE McCallan Castles
Tennessee stats (11 games):
- White: 54 rec., 654 yards, 2 TD, 12.11 yards per reception, 59.45 YPG
- Keyton: 28 rec., 469 yards, 4 TD, 16.75 yards per reception, 42.64 YPG
- Castles: 18 rec., 218 yards, 3 TD, 12.11 yards per reception, 19.82 YPG
- Nimrod: 13 rec., 141 yards, 1 TD, 10.85 yards per reception, 12.82 YPG
Vanderbilt: Will Sheppard, London Humphreys, Jayden McGowan, Junior Sherrill
Vanderbilt stats (11 games):
- Sheppard: 45 rec., 450 yards, 8 TD, 14.2 yards per reception, 58.2 YPG
- Humphreys: 19 rec., 413 yards, 4 TD, 21.7 yards per reception, 37.5 YPG
- McGowan: 36 rec., 383 yards, 0 TD, 10.6 yards per reception, 34.8 YPG
- Sherrill: 16 rec., 241 yards, 2 TD, 15.1 yards per reception, 21.9 YPG
Advantage: Tennessee
Explanation: Not many receiving groups are going to be worse than Tennessee’s in the SEC, but Vanderbilt’s is. The Vols simply have the best player, and it’s not close, in Squirrel White. Sure, some Commodore receivers may be able to spring free and make a couple of plays, and it wouldn’t surprise me in the slightest if the Vanderbilt receivers have more total yards than the Tennessee wideouts because of how well (and much) the Vols will run the ball.
But when it comes to stats and ability to have an impact on the game, Tennessee gets the edge thanks in large part to Squirrel White.
More From RTI: Vanderbilt at No. 21 Tennessee: How to Watch, Betting Odds, Key Stats and Info
Offensive Line
Tennessee stats (11 games):
- Joe Milton sacked 15 times (6th-best in the SEC)
- Tennessee has given up 17 total sacks as a team (1.55 per game)
Vanderbilt stats (11 games):
- Ken Seals sacked 13 times
- AJ Swann sacked 9 times
- Vanderbilt has given up 25 total sacks as a team (2.27 per game)
Advantage: Tennessee
Explanation: Sack numbers are easy to look at and give Tennessee the edge here. The Vols have given up eight less sacks. However, don’t expect Tennessee’s offensive line to necessarily perform at a very high level against the Commodores given the fact that multiple backups will be starting.
Still, I’ll take Tennessee’s second-string talent over Vandy.
Defensive Line
Tennessee stats (11 games):
- 34 sacks (T-2nd in SEC & T-7th in FBS)
- 3.09 sacks per game (2nd in SEC, 7th in FBS)
- 86 TFL (2nd in SEC, 5th in FBS)
- 7.8 TFL per game (2nd in SEC, 5th in FBS)
Vanderbilt stats (11 games):
- 20 sacks (12th in SEC & T-92nd in FBS)
- 1.82 sacks per game (12th in SEC, T-53rd in FBS)
- 64.0 TFL (9th in SEC, T-53rd in FBS)
- 5.8 TFL per game (9th in SEC, T-53rd in FBS)
Notable player stats:
Tennessee:
- LEO James Pearce Jr.: 8 sacks, 11.5 TFL, 13 QB hits, 1 FF
- DE Tyler Baron: 5 sacks, 9.5 TFL, 5 QB hits, 1 FR
- DT Omarr Norman-Lott: 5.5 sacks, 6 TFL
Vanderbilt:
- DE Nate Clifton: 5.5 sacks, 7.5 TFL, 4 QB hits, 1 INT
- ANCHR CJ Taylor: 3 sacks, 7.5 TFL, 1 QB hit, 2 FF, 3 PBU, 2 INT
Advantage: Tennessee
Explanation: Tennessee has the advantage with their pass rush and and defensive line. They’ve been better at getting after the quarterback and tackling players for a loss. Even though James Pearce Jr. and Tyler Baron haven’t been as dominant as they were earlier in the season, they still can make a sizable impact in any game.
Linebackers
Tennessee: Aaron Beasley, Elijah Herring
Tennessee stats (11 games):
- Herring: 71 tackles (27 solo), 2.5 TFL, 1 QBH
- Beasley: 63 tackles (34 solo), 3 sacks, 11.5 TFL, 3 PBU, 1 QBH, 1 INT, 1 TD
Vanderbilt: Langston Patterson, Ethan Barr
Vanderbilt stats (11 games):
- Patterson: 66 tackles (34 solo), 8 TFL, 1 sack, 1 INT, 1 QBH, 1 FF
- Barr: 48 tackles (18 solo), 3 TFL, 1 sack, 1 PBU, 1 QBH, 1 FF
Advantage: Tennessee
Explanation: Like every position, Tennessee has the natural edge as the Vols’ linebackers are simply better, although they aren’t great. However, it is important to note that Langston Patterson is the one player everyone should be keeping a keen eye on on the Commodores’ defense.
Secondary
Tennessee stats (11 games):
- 87th in FBS in Opp. Passing YPG (235.5)
- Before the Missouri game, the Vols were 57th in passing defense.
- 10 INT (3 pick sixes) (T-6th in SEC)
- 31 pass deflections (11th in SEC)
- 24th in FBS in yards per completion (10.8)
- 76th in FBS in pass efficiency defense
Vanderbilt stats (11 games):
- 121st in FBS in Opp. Passing YPG (264.2)
- 12 INT (4th in SEC)
- 27 pass deflections (14th in SEC)
- 40th in FBS in yards per completion (11.22)
- 110th in FBS in pass efficiency defense
Advantage: Tennessee
Explanation: Another position group for Tennessee that isn’t good but is still better than Vanderbilt’s. The Vols’ pass defense has been significantly worse since Kamal Hadden’s injury, but Vanderbilt has been bottom of the barrel in the SEC in pass defense, so there’s no reason to take them over Tennessee.
Special Teams
Tennessee: PR & KR Dee Williams
Tennessee stats (11 games):
- Williams punt returns: 14 returns, 224 yards, 16 AVG, 1 TD, 55 long
- Williams kick returns: 9 returns, 183 yards, 20.33 AVG, 34 long
Vanderbilt: PR Will Sheppard, KR Jayden McGowan
Vanderbilt stats (11 games):
- Sheppard punt returns: 9 returns, 42 yards, 4.7 AVG, 40-long
- McGowan kick returns: 16 returns, 384 yards, 24 AVG
Tennessee: K Charles Campbell and P Jackson Ross
- Campbell: 16/20 on FGs (0/3 50+, 3/4 40-49)
- Ross: 45 punts, 1,934 yards, 42.98 yards per punt, 71 long, 3 touchbacks, 17 inside the 20, 9 punts of 50+
Vanderbilt: K Jacob Borcila, P Matt Hayball
- Borcila: 6/9 on FGs (0-0 50+, 2/4 40-49)
- Hayball: 50 punts, 2,410 yards, 48.2 yards per punt, 3 touchbacks, 20 inside the 20, 20 punts of 50+
Advantage: Vanderbilt
Explanation: Actually going Vanderbilt here. McGown has a long kickoff return touchdown but has still been solid otherwise. Also, their punter has been ridiculous this season, and we all know he’ll have many attempts against Tennessee.
Lastly, Charles Campbell has been a tad inconsistent.
Total Score:
Tennessee: 8
Vanderbilt: 1


